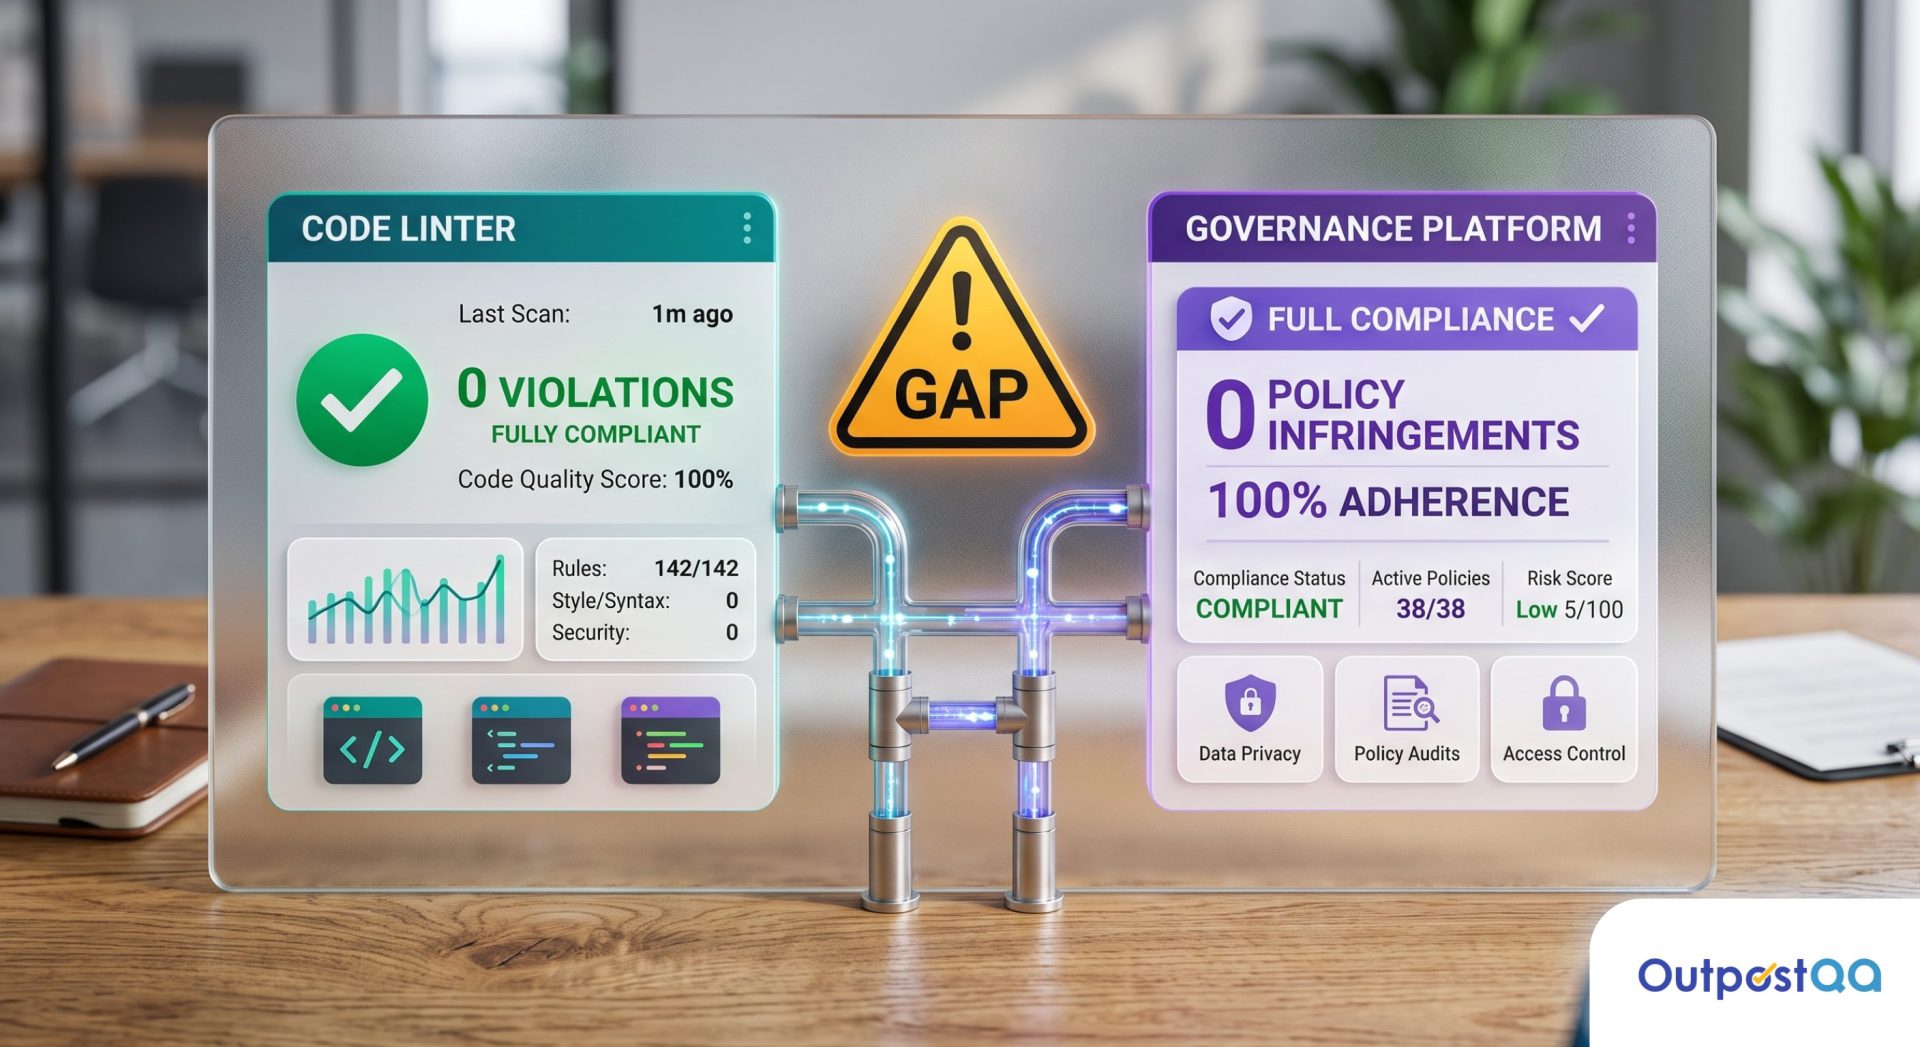

Your performance tests are passing. Your production environment is on fire. That gap is not a tooling problem; it is a test design problem, and it is more common than any QA director wants to admit.
TL;DR
- Most performance tests fail to reflect production because load profiles are synthetic, environments are under-resourced, and critical stack components are missing from the test scope.
- A valid performance test starts with real usage data, defined acceptance thresholds, and an environment that mirrors production infrastructure as closely as possible.
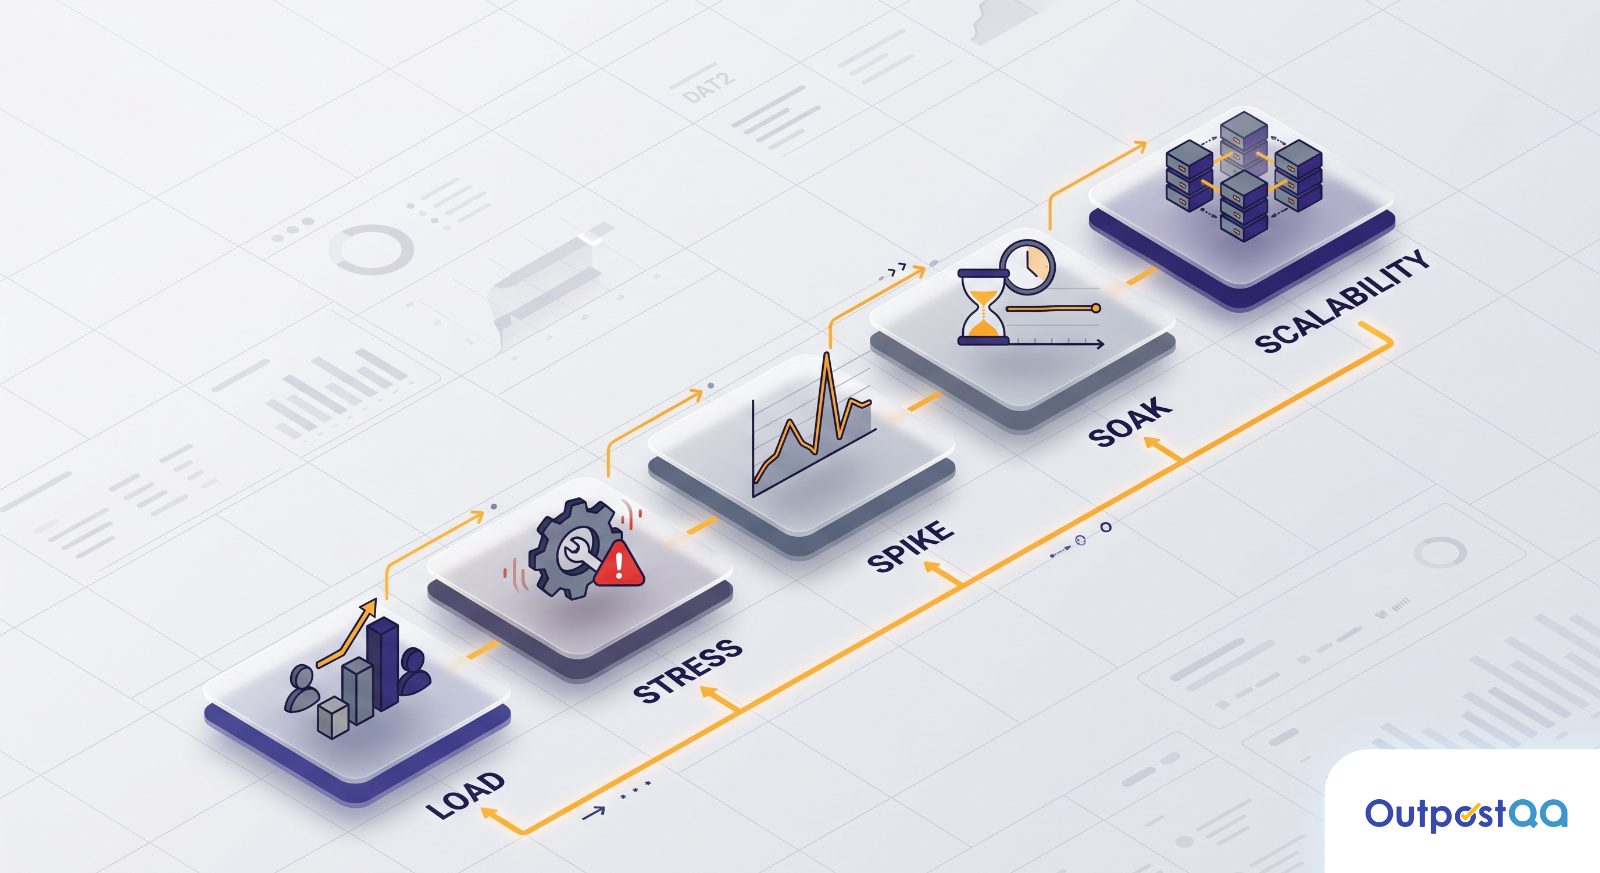
- The five test types (load, stress, spike, soak, and scalability) serve distinct purposes and must be run at different stages of the release cycle.
- Tool selection matters less than test design: k6, JMeter, and Gatling are all capable; the question is whether they are configured to simulate what users actually do.
- Performance testing does not end at launch; continuous performance gates in the CI/CD pipeline are the only way to catch regressions before they reach users.
What Web Application Performance Testing Actually Measures
Performance testing validates how a system behaves under a defined set of conditions: specific user volumes, request patterns, data payloads, and infrastructure constraints. It does not measure whether the application works correctly. Functional testing handles that. Performance testing measures whether the application works acceptably when real people use it at scale.
The four properties a performance test evaluates are speed (response time under normal load), stability (consistent behavior over time), scalability (the system’s ability to handle growth), and resource efficiency (how much infrastructure is consumed to serve a given load). A test plan that does not address all four is incomplete, regardless of how many virtual users it spins up.
Most Performance Tests Are Measuring the Wrong Thing
Passing a performance test in staging does not mean the application will survive production. It means the application survived the conditions you simulated, which are almost never the conditions production actually creates.
Why Synthetic Load Profiles Do Not Match Real User Behavior
Most teams generate load by sending a fixed number of concurrent requests at a uniform rate for a fixed duration. Real users do not behave that way. They arrive in waves, linger on certain pages, abandon sessions mid-flow, and hammer specific endpoints disproportionately during events like a product launch or a billing cycle.
A synthetic profile that sends 500 requests per second uniformly for 10 minutes will mask the exact failure patterns that emerge when 500 users hit the checkout endpoint simultaneously because a promotional email landed in 200,000 inboxes at 9:00 AM. The test passes; the real event fails.
The Staging Environment Trap
Staging environments are typically provisioned at a fraction of production capacity. A common ratio is 25 to 50 percent of production CPU and memory, with a database seeded from a small snapshot rather than a full production clone. Testing against that environment tells you how a smaller, lighter version of your application performs, not how your actual application performs.
Infrastructure topology also diverges. Staging frequently skips third-party service integrations, CDN layers, and database read replicas. Each omission creates a blind spot. The CDN cache miss rate, the read replica lag under heavy query load, the timeout behavior of a third-party payment API under concurrent requests: none of these appear in a staging-only test.
What Gets Left Out of the Average Performance Test Plan
Beyond the environment gap, three components are routinely absent from performance test plans:
- Database query behavior under realistic data volume: Tests run against a 10,000-row database will not expose the query plan degradation that occurs against a 50-million-row production table.
- Session and authentication overhead: Many test scripts skip the login flow entirely, which removes the authentication service, session store, and token validation from the load profile completely.
- Background jobs and async processes: Queued tasks, scheduled jobs, and webhook consumers compete for the same resources as request handlers. A test that ignores them will understate the real resource contention.
The Five Types of Performance Tests and When to Run Each One
Not every performance test answers the same question. Running the wrong type wastes engineering time and produces misleading results.
Load Testing: Validating Expected Traffic Ceilings
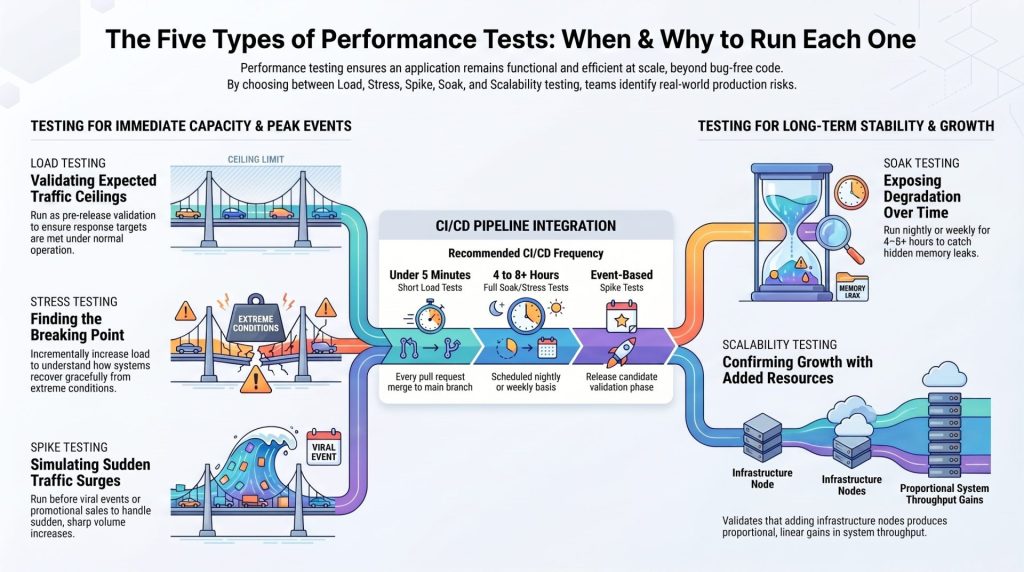
Load testing confirms that the application meets its response time and error rate targets under the traffic volume you expect in normal operation. It is the baseline test every application needs before any release. Run it as part of pre-release validation and after any significant architectural change.
The acceptance criteria should be specific: for example, 95th percentile response time under 800ms at 1,000 concurrent users with an error rate below 0.5 percent.
Stress Testing: Finding the Breaking Point Before Users Do
Stress testing incrementally increases load beyond the expected ceiling to identify where the system degrades and how it recovers. The goal is not to see whether the system breaks; the goal is to understand how it breaks and whether it recovers gracefully when load drops back to normal.
A system that crashes under 3x expected load and requires a manual restart is a different operational risk than one that degrades response times at 3x load but recovers automatically. Stress testing surfaces that distinction before users experience it.
Spike Testing: Simulating Sudden Traffic Surges
Spike testing applies sudden, sharp increases in load without the gradual ramp-up of a stress test. This simulates the conditions created by a viral event, a promotional campaign, or a flash sale. The system must handle the surge, not just survive a slow increase.
Run spike tests before any planned high-traffic event and as part of the release cycle for any feature tied to external promotion.
Soak Testing: Exposing Memory Leaks and Degradation Over Time
Soak testing (also called endurance testing) runs a sustained, moderate load for an extended period, typically four to eight hours or longer. It is designed to expose issues that only emerge over time: memory leaks, database connection pool exhaustion, file descriptor accumulation, and gradual response time degradation.
Short-duration tests will not catch these. A soak test that reveals a 20 percent response time increase over six hours identifies a memory leak that would cause a production incident on a busy Tuesday afternoon.
Scalability Testing: Confirming the System Grows When You Add Resources
Scalability testing validates that adding infrastructure resources (additional application servers, database replicas, cache nodes) produces proportional throughput gains. This matters most for systems running on auto-scaling infrastructure: if scaling out does not improve performance linearly, the auto-scaling policy will not protect the system during peak load.
Step 1: Define Performance Baselines and Acceptance Thresholds Before Writing a Single Test
Every performance test must answer a specific question against a specific threshold. Without defined thresholds, test results are numbers without meaning. “Response time was 1.2 seconds” is not a pass or fail; it is a data point. “Response time exceeded the 800ms 95th percentile threshold for the checkout endpoint” is an actionable failure.
Define the following before writing the first test script:
- The business-critical user flows to test (login, search, checkout, report generation).
- The expected concurrent user volume for normal operation and for peak events.
- The response time targets by percentile (p50, p90, p95, p99) for each flow.
- The acceptable error rate threshold.
- The infrastructure resources allocated (CPU, memory, connection pool limits).
These thresholds should come from product and engineering leadership, not from the QA team alone. A performance threshold is a business decision as much as a technical one.
Step 2: Build a Realistic Load Profile from Actual Usage Data
Realistic load profiles come from production data, not from assumptions. If the application is already in production, use your analytics platform or access logs to extract:
- Peak concurrent user counts and the times of day they occur.
- The distribution of requests across endpoints (which pages and APIs receive the most traffic).
- Session duration and the average number of requests per session.
- The ratio of read to write operations.
If the application has not yet launched, use data from comparable applications, industry benchmarks, or early beta traffic. A profile built on real data will surface issues that a uniform load pattern will never expose.
Map the data into a test scenario that replicates the user journey, not just the volume. A load test that sends 1,000 requests per second uniformly against the homepage is less valuable than one that sends 600 requests to the homepage, 250 to the product catalog, 100 to the cart, and 50 to the checkout endpoint, distributed to match the real conversion funnel.
Step 3: Set Up Your Test Environment to Mirror Production as Closely as Possible
Environment parity is the single highest-leverage improvement most teams can make to their performance testing program. The goal is not a perfect copy of production; that is rarely practical. The goal is to eliminate the gaps that produce false confidence.
Prioritize these four areas:
- Infrastructure sizing: Provision the test environment at production-equivalent CPU and memory ratios. If full parity is not possible, document the delta and adjust your result interpretation accordingly.
- Data volume: Seed the test database with a representative volume of production-scale data, including the indexes, foreign keys, and query patterns that production data creates.
- Third-party integrations: Use sandboxed or stubbed versions of critical third-party services (payment processors, identity providers, external APIs) that replicate realistic latency and failure behavior rather than returning instant success responses.
- Network topology: Include the CDN layer, load balancer configuration, and any API gateway rules that production traffic passes through.
Any gap between the test environment and production is a potential source of false confidence. Document every known gap and treat it as a risk that must be accepted explicitly by engineering leadership, not quietly absorbed by QA.
Step 4: Select and Configure Your Performance Testing Tool for the Job
Tool selection matters less than most teams assume. The tool executes the test design; it does not create one. A well-designed test run on JMeter will outperform a poorly designed test run on k6 every time.
When to Use k6, JMeter, or Gatling
Each tool has a genuine home:
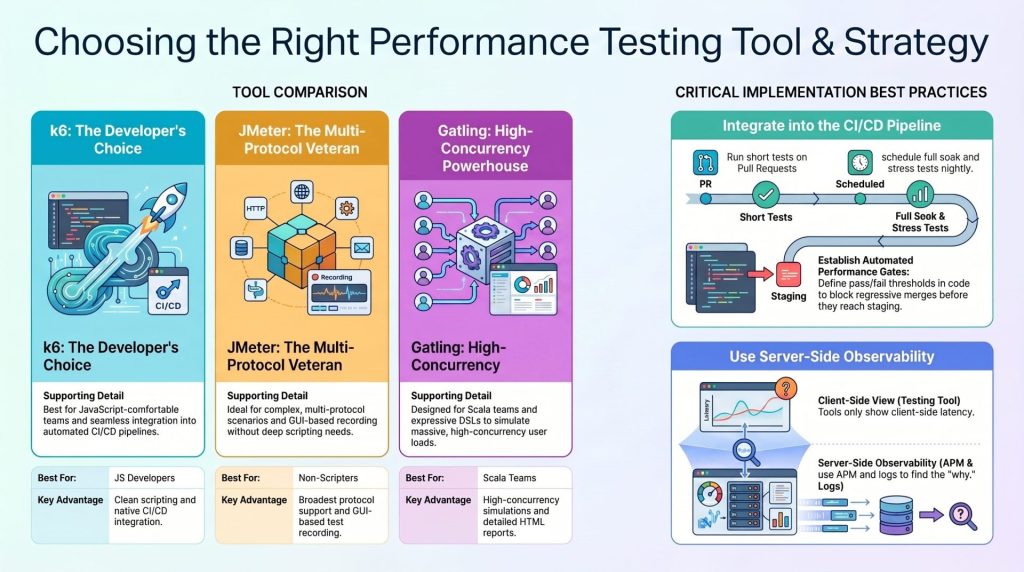
- k6: Best for developer-centric teams comfortable writing JavaScript. The scripting model is clean, the CLI output is readable, and the native Grafana integration makes metric visualization straightforward. Strong choice for teams embedding performance tests in CI/CD pipelines.
- JMeter: The most mature option with the broadest protocol support (HTTP, JDBC, JMS, LDAP). The GUI-based test recorder is useful for teams without strong scripting backgrounds. Better suited for complex, multi-protocol test scenarios.
- Gatling: Strong choice for Scala-comfortable teams or those running high-concurrency simulations. The DSL is expressive and the HTML reports are detailed. The open-source version covers most use cases.
No tool in this list is wrong for web application performance testing. Choose based on your team’s existing skills and the tooling already present in your pipeline.
Integrating Performance Tests into Your CI/CD Pipeline
Performance regressions are caught earliest when performance tests run automatically on every significant code change, not only before release. The practical implementation depends on test duration:
- Short load tests (under five minutes) can run on every pull request merge to the main branch.
- Full soak and stress tests should run on a scheduled nightly or weekly basis, not on every commit.
- Spike tests should run as part of the release candidate validation phase.
Both k6 and Gatling publish native integrations with GitHub Actions and most major CI systems. Define pass/fail thresholds in the pipeline configuration so that a performance regression blocks the merge rather than appearing in a report that someone reads three days later.
What Your Tool Cannot Tell You on Its Own
Every performance testing tool measures the client-side perspective: request duration, error codes, throughput. None of them tell you why a response was slow. A 2-second response time from the tool could mean a slow database query, an overloaded application server, a congested network path, or a blocking external API call.
You need server-side observability alongside the load generator: application performance monitoring (APM) data, database slow query logs, infrastructure metrics (CPU, memory, I/O), and distributed traces. The tool tells you a problem exists; the observability stack tells you where it lives.
Step 5: Execute, Monitor, and Capture the Metrics That Matter
Running the test is not the end of the execution phase. Active monitoring during the test run is what separates useful data from misleading summaries.
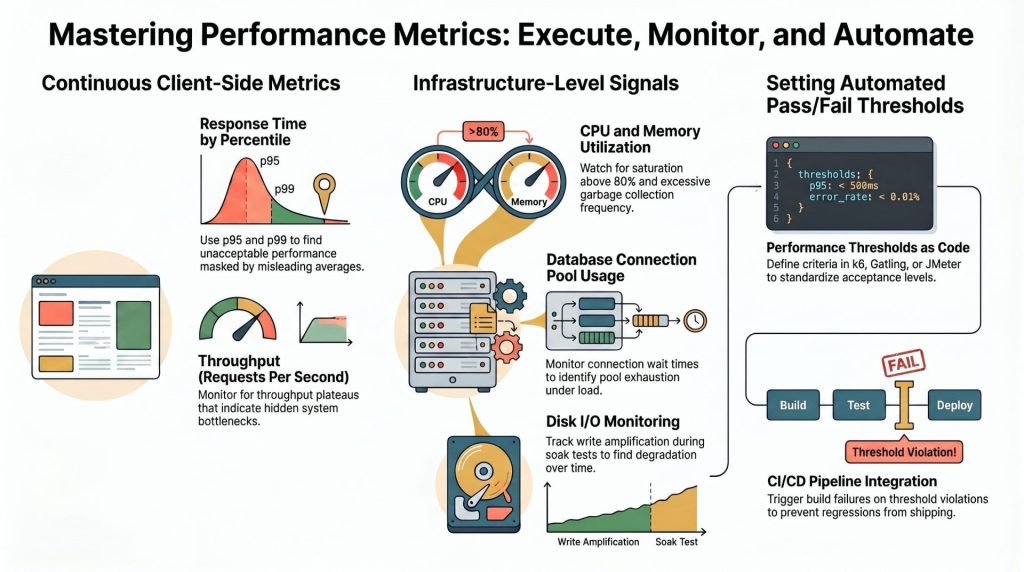
Response Time, Throughput, and Error Rate
Monitor these three metrics continuously during the test, not only in the post-run report:
- Response time by percentile (p50, p90, p95, p99): The average is almost always misleading. A p95 of 3 seconds with a p50 of 200ms means that 5 percent of users are experiencing unacceptable performance, even though the average looks healthy.
- Throughput (requests per second): Track whether throughput degrades as load increases. A throughput plateau before the target user count is reached indicates a bottleneck.
- Error rate by endpoint: Aggregate error rates hide endpoint-specific failures. A 0.5 percent aggregate error rate might mean the checkout endpoint has a 12 percent error rate that is masked by the high volume of successful homepage requests.
Infrastructure-Level Signals: CPU, Memory, and Database Connections
Client-side metrics without server-side context produce incomplete diagnoses. Capture during every test run:
- CPU utilization on application servers and database servers, watching for saturation above 80 percent.
- Memory utilization and garbage collection frequency (for JVM or Node.js applications).
- Database connection pool usage; watch for connection wait times that indicate pool exhaustion.
- Disk I/O on database servers, particularly during soak tests where write amplification may emerge over time.
Setting Automated Pass/Fail Thresholds in the Pipeline
Define performance thresholds as code. In k6, this is the thresholds configuration object. In Gatling, it is the assertions block. In JMeter, it is the Summary Report combined with a build-breaking plugin like the Performance Plugin for Jenkins.
The pipeline should return a non-zero exit code on threshold violation, which triggers a build failure. This is the mechanism that prevents a performance regression from shipping silently while the team is focused on feature work.
Step 6: Analyze Results and Translate Findings into Engineering Action
A performance test report that says “p95 response time was 2.3 seconds; threshold is 800ms” has done half the job. The other half is identifying what caused the degradation and expressing it in terms that engineering can act on.
Work through the analysis in this sequence:
- Identify which endpoints exceeded thresholds and at what user concurrency level the degradation began.
- Correlate the client-side degradation with server-side metrics at the same timestamp: was CPU saturated, was the database connection pool exhausted, did memory climb continuously?
- Pull slow query logs from the database during the test window and identify the queries with the highest execution time and frequency.
- Check distributed traces for the slowest requests to identify which service or dependency contributed the most latency.
- Document the finding as a specific, reproducible condition: “The order history endpoint degrades to 2.3 seconds p95 at 600 concurrent users due to an N+1 query pattern on the line items table.”
That last sentence gives engineering a specific problem, a specific threshold, and a specific cause. It is actionable. “Performance was slow” is not.
Performance Testing Does Not End at Launch
Launch is not the finish line; it is the point at which the stakes go up. Code changes, feature additions, dependency updates, and infrastructure migrations all introduce regression risk after launch. A checkout flow that performed at 400ms p95 at launch can degrade to 1.8 seconds three months later after a framework upgrade and two new third-party integrations were added without a corresponding performance test.
The teams that catch regressions before users do are the ones that have embedded performance gates into their CI/CD pipeline and run scheduled endurance tests against production-equivalent environments on a regular cadence. Performance testing becomes part of the release process, not a one-time pre-launch exercise.
Outpost QA’s Test Automation & CI/CD practice builds these gates directly into client pipelines, so regressions surface in the build log before they reach staging. For teams dealing with the specific challenge of hardware and firmware performance alongside web application testing, the Hardware, IoT & Firmware Testing capability extends the same rigor to the full product stack.
If your current performance test suite passes in staging but you are still seeing production incidents, the test design is the problem, not the tools. A focused review of your load profiles, environment configuration, and acceptance thresholds can identify the gaps in a single working session.
Book a performance testing strategy session with an Outpost QA engineer to assess whether your current test design reflects real production conditions.
Frequently Asked Questions
What is the difference between load testing and performance testing?
Performance testing is the broad category that includes all tests evaluating speed, stability, scalability, and resource efficiency. Load testing is one specific type within that category: it validates behavior under the expected normal and peak traffic volumes. Every load test is a performance test, but not every performance test is a load test.
How many virtual users should I use in a performance test?
The number of virtual users should reflect your actual or projected peak concurrent user count, derived from analytics or access logs rather than an arbitrary round number. The right number is the one that recreates the resource contention and request volume your production environment actually experiences during peak periods.
Can I run performance tests in a shared staging environment?
You can, but the results will be less reliable. Shared environments introduce variable resource contention from other processes and teams. If a dedicated performance environment is not available, run tests during off-peak hours, document the environment specifications explicitly, and treat results as directional rather than definitive.
How often should performance tests run?
Short load tests should run on every merge to the main branch. Full stress and soak tests should run on a scheduled nightly or weekly cycle. Spike tests should run as part of release candidate validation before every significant deployment. The cadence scales with the duration and cost of the test.
What should I do when a performance test fails in CI?
Treat it the same way you treat a failing functional test: the merge is blocked until the regression is investigated and resolved. Start by identifying which endpoint exceeded its threshold, correlate with server-side metrics at the time of failure, and work backward to the most recent code change that could have introduced the degradation. A failed performance gate is information, not an inconvenience.